Sunday, September 23, 2012

Measuring your Environmental Education Effort


Measuring your Environmental Education Effort


It may be statistically meaningful to talk about the number of students exposed to Environmental Education, but it is educationally meaningless.

The real unit is NOT the number of students but the total number of contact hours for the total number of students. That is the total number of students multiplied by the number of hours each student has been exposed to this class. This index can help to evaluate the program.


The main objective of this paper is to provide you with a measuring tool regarding exposure to the subject and length of program.

A conscientious Environmental Education Program should include, pre-classes, field trips, data collection, post- classes and the production of a final project report.


One of the most important issues discussed by environmental educators these days is the question of doing short-term vs. long-term programming. Is it really worth our effort doing one-time programs that last only one hour?


Now, and for the last twenty years, I have refused to do “one-shot” deals. By this I mean small programs that last no more that 60 or maybe 90 minute in a classroom or in the field, for no more that 30 students. All my programs are designed to provide students with multiple exposures. I really do not think that the goals and objectives that I pursue in environmental education can be reached in a short time.


In order to explore this question, we need to question ourselves about the goals and objectives of Environmental Education. The EPA states the following in their website:

Environmental education (EE) increases public awareness and knowledge of environmental issues and challenges. Through EE, people gain an understanding of how their individual actions affect the environment, acquire skills that they can use to weigh various sides of issues, and become better equipped to make informed decisions. EE also gives people a deeper understanding of the environment, inspiring them to take personal responsibility for its preservation and restoration. UNESCO/UNEP (1978)

The definition of Environmental Education according to the United Nations Environmental, Scientific, and Cultural Organization (UNESCO) 1975 states:


 The goal of environmental education is to develop a world population that is aware of, and concerned about, the environment and its associated problems, and which has the knowledge, skills, attitudes, motivations, and commitment to work individually and collectively toward solutions of current problems and the prevention of new ones. United Nations Environmental, Scientific, and Cultural Organization (UNESCO) 1975


Can we accomplish these objectives in one hour? It is possible that our cumulative effort may prove to be successful in carrying out these objectives. It is clear that today’s school children are influenced by a number of inputs and sources (some good and some bad) that may affect their actions in the environmental area. Television for one has done a great job of educating students with a large number of very well produced programs on natural history and exploring environmental issues such as Science Explorer, The Animal Channel and National Geographic. Most textbooks these days have been designed to teach many subjects from an environmental point of view. In addition environmental issues are included in our everyday life in politics, in the newspaper and TV news and in many of our daily discussions. But on the other hand, television news provides less than desirable short bursts of environmental news that lack depth and accuracy in many cases.


In addition to the issues stated above, we also need to explore the realistic economic reasons why most nature centers can only provide student groups with a one or maybe two-hour programs. Schools often could not pay for several programs and afford the bussing required to bring the students to the environmental centers. There is a cost of the program for each child and the cost of substitute teachers and teacher aids.


In December 1996, the National Environmental Education Advisory Council submitted its first report to Congress on environmental education. The report made a number of policy recommendations. One of these recommendations was to develop measuring tools to evaluate the effectiveness of environmental education.


Develop a framework and tools for measuring the effectiveness of environmental education.


Quality environmental education initiatives are well understood to have catalyzed changes in individuals’ environmental knowledge, skills, attitudes, and behaviors. Assessment is needed to document these outcomes. These outcomes, in turn, point to which programs, products, and services are working – and why.

The long-term goals of environmental education are to raise the level of environmental literacy among Americans today and to ensure the environmental literacy of each successive generation in order to improve environmental and health protection and economic prosperity. Although it is unrealistic to expect any single environmental education program to achieve these long-term goals, it is possible to measure the short-term outcomes of a program (such as skill development, knowledge gains, attitude changes, and the intent to change behavior) as well as the intermediate outcomes (such as actual changes in behavior related to practices, decisions, policies, and social actions).

Evaluation guidelines must be developed and tools must be disseminated to ensure that measurement takes place and is conducted consistently. In this way, outcomes of individual initiatives can be appropriately measured and can contribute to a cumulative body of results that point to the long-term goals of environmental education – environmental literacy and quality of life.

Comprehensive, long-term evaluation should include both quantitative and qualitative assessment strategies to provide an in-depth understanding of the effectiveness of environmental education programs for adults as well as for youth.


Measuring knowledge, skills, attitudes, and behaviors may not be an easy task. Knowledge and skills can be measured by providing the students with a pre and a post- test. Attitudes and behavior are much more difficult to test as these characteristics are a reflex ion of the student’s day-to-day actions.


I have often used pre-tests to assess the knowledge and skills of students. In most cases I am able to assess how much they do not know but that is often a waste of time. Post-test are essential if we want to know how successful we were in our class. On most cases hand-on and task oriented environmental education classes where students produce a product can be interchanged with the pos-test. As a matter of fact, if one works with students on a long-term project, the production of the product will always be much more intensive and a better indicator than any post-test we can give the students.


The quality of our programs is dependent on a number of things. Apart from the quality of the teacher doing the job, which can not be easily measured, there are number of facts that influence each program:


Ø  The number of students in the class.

Ø  The aid provided by the schoolteacher.

Ø  The location where the program is conducted.

Ø  The resources used to teach.

Ø  The ability of providing a hands-on program.

Ø  The children’s behavior.

Ø  The time used to explore the subject or length of the program.

Ø  The pre- and post- class materials used, including tests teaching aids and more.


You can fill an auditorium with one thousand people, stand in front of the microphone and spend the next ten minutes talking about the great importance of a sustainable environment, but you can be sure that a few hours later these people will not even remember who you were or what you were talking about. Only a few exceptional people such as Jane Godley or E. Wilson can in ten minutes make an impression on a thousand.


A regular teacher needs to use a very different approach, one that will provide the students with lesson that will nurture the students’ interest and comprehension of issues, and encourage a sense of ownership and stewardship of the environment.


Here in Connecticut, and for a number of years, we have provided high schools with a water quality program called the SEARCH program. Teachers are trained once, during the summer, to participate in the program. In many cases we have provided teachers with equipment and other resources so that they will be able to complete the program.

Students are introduced to mapping, water chemistry, aquatic entomology, mathematic matrices, and other analytical methods, data analyses, use of computers to write papers and use of spread sheets, and we also provide them with a forum at the end of the year to present their conclusions. Teachers can provide the data to our agency and we also have set up quality control protocols to evaluate the quality of the data. Students enrolled in the program spend more than two weeks working on the project. In some cases, some of the schools complete several field visits, and collect a considerable amount of data.


In January 1999, Dr. Todd W. Rofuth and Dr. Sue Holloway submitted a five year final evaluation report were they found significant behavioral changes in students due to their participation in the SEARCH program.


Several summers ago I completed a new program with the SOUND SCHOOL in Hew Haven, Connecticut. During the two-week program fifteen 9th grade students completed lectures and classes on primary and secondary productivity. They took a boat and collected five sets of samples in the sound at three different locations within the New Haven Harbor and tested the samples for chlorophyll a and a vast array of parameters such as Dissolved Oxygen, nitrates, phosphates, pH and much more. Two Environmental Science college students helped the students in their tasks and completed a similar study at the university, so that we could compare results.


The high school students learned about their town, and evaluated historical changes and the environmental issues of New Haven and its harbor. In addition they became experts in water quality testing and water quality issues. They had a great experience a great time and ended their job with a nice tan.


These days I have been involved with two new programs, Project CLEAR and Project Periphyton. Both programs take the students to the field, provide lectures to the teachers and to the students and the information and data collected by the students is provided to several state and federal agencies.


Educating students is not a fast and easy job. It requires structure, patience, individualized attention and experiential exposure. Nothing that you or anyone can do in a short time!


We can evaluate our programs in total number of contact hours and we can also evaluate the impact of each program to each student in number of contact hours per student.


Here is a sample for three different programs:


Program
# Students
# Hours
Program evaluation (# students * Hours)
Student impact in contact hours.
 
New Haven
15
98
1470
6.5
SEARCH
20
35
700
1.75
Nature Center Program *
20
2
40
0.1
Program with field trip Pre and Post Class **
20
9
180
0.45


*This would be the classic school field trip to a nature center.

**This would be the same as the Nature Center Program but with added written pre-    and post-lessons for the teacher to use.


It is our job to provide education to as many students as possible and funders are always interested in extending the value of the dollar invested on each program, but some times we may be wasting our time. We need to concentrate on our goals and objectives and not in our ability to reach a large number of students. Quality is not the quantity of students; it is what the students learn and how that learning affects their approach to life.


The future of the earth and the future of mankind are at stakes here. The importance of quality education should not be a question. Education is not cheap and the thread of such things as “Global Warming” or the disappearance of one species is more expensive.


Bibliography


1975. Definition of Environmental Education.  United Nations Environmental, Scientific, and Cultural Organization (UNESCO) The world's first intergovernmental conference on environmental education was organized by the United Nations Education, Scientific, and Cultural Organization (UNESCO) in cooperation with the U.N. Environment Programme (UNEP) and was convened in Tbilisi, Georgia (USSR) from October 14-26, 1977. UNESCO/UNEP 1978. ‘The Tbilisi Declaration’ , Connect, Vol 3, No. 1, pp 1-8.


Hollowway, S., T. W. Rofuth, H. Gruner, and A. Mimo. 1998. Can applied science in environmental monitoring transform science education? The Education Forum. (62)4: 354-362.


Mimo, A. 2000. History and Phylosophy of the SEARCH Program. New England Journal of Environmental Education. v. 13, Number 1. 18 – 27.


Coyle, K. 2005. What Ten Years of NEETF/ Roper Research and Related Studies Say About Environmental Literacy in the U.S. Environmental Literacy in America. The National Environmental Education & Training Foundation, Washigton, D.C.

Sunday, June 12, 2011


PROJECT PERIPHYTON
SEDIMENT SAMPLE REPORT


How to complete this activity and what you can get out of it.


The following paper was developed for teachers and their students to have an example of the type of research that can be completed with the sediment samples obtained at Milford Point. Students can copy some of the laboratory methods or devised new ways to interpret the data. I have also included some optional reading that will help students understand the Long Island Sound Geology and its sedimentation since the last glacier event.


Introduction

Methods and Materials
A sediment sample was taken on 5/4/2011 from Milford Point in Milford, Connecticut to be analyzed for sedimentation rate and diatom content. This sediment was extracted from the muddy shore right in front of the Audubon Coastal Center using a PCV home made sediment core sampler. Latitude and Longitude was 41.17615 and -73.10107.
Sediment samples contain a percentage composition of sand, silt, clay and other organic and mineral components at sedimentation rates through out time.

Based on studied completed by the University of Connecticut, at Every Point by Frank W. Bohlen (personal communications) sedimentation rate in Connecticut shores can be about one centimeter per year. The total core extracted was 35 centimeter in length. So based on that rate the oldest part of the core is about 35 years old.

Sediment sample was taken using a home made core sampler shown on the picture. This PCV pipe contains an inner plastic tube. Core was captured by this tube. Once on the laboratory, the plastic tube was cut and the sample exposed for experimentation.


In this exercise, I wanted to compare the oldest section of the core against the most recent section, so samples were taken from both ends of the core. The one referred as "the top" is the most recent one, sedimentation dated to be from the last 5 years, and the one referred as "the bottom" would be the oldest section of the core that I have estimated to be 35 years old.

Sediment size, silt and clay content, and diatom diversity was assess from both end and the results were analyzed.

Sediment Rate

Sediment analysis
The sediment was assessed for sand vs. silt and clay and particle size content using the same methods recommended by Howard M. Weiss and Michael W. Dorsey on their Project Oceanology teacher manual Investigating The Marine Environment: Source book. 1979. Methods are reproduced in the Project Periphyton Manual.

Diatom Biodiversity
Diatom biodiversity was assessed using the methods recommended by Alberto F. Mimo in my manual "Project Periphyton" 2011. . Methods are reproduced in the Project Periphyton Manual.


Sediment Composition
To asses the sediment composition of the core section, a small piece of core was cut using a knife, dried using a convention oven and weighted to +/- 0.1 grams.
Sediment then separated by using a Mini Sieve set. The Mini-Sieve set comes with 8 sieve sizes. Numbers 230, 170, 120, 80, 60, 45, 35 and 25. Sand particles include any particle that would be retained by anyone of these sieves. Anything smaller that .063 mm would be considered silt or clay.


For our experimentation I only used sieves number 25, 35, 45 and 60 corresponding to particle size .71 mm, .5 mm. , .355 mm. and .25 mm. Smaller sieves are impractical to use, so anything that pass through my smaller filter was consider < .25 mm. Water was used to force particles through the filters. At the end all particles captured were dried and weighted. Two samples were selected, one from the top of the core, corresponding to new sediments and one from the bottom of the core corresponding to about 35 years ago. Results Sediment dry weight and percentage 35 years old T W Size 25 Size 35 Size 45 Size 60 Size >60
Weight (gr.) 16.6 2.1 1.7 2.1 2.3 8.4
% 12.6506 10.24096 12.6506 13.85542 50.60241
New Sample 11.9 1.1 1.4 1 2.9 5.5
% 9.243697 11.76471 8.403361 24.36975 46.21849

See Graph.


Conclusions
During the last 35 years there has been very little change in the sediment composition left on the shore of Milford Point. Composition of sediment sizes are very similar. During that time, the most significant change has been on sediment size corresponding to .25 mm. in size with a negative change of 10.51 percent. Small particle size of < .25 mm which includes some sand, sit and clay have a positive change of 4.39 percent during the last 35 years. See graph.


Science Education is not about answers but about questions. Our objective is to provide students with materials that will bring up their interest and curiosity. In this sedimentation rate exercise we know that there has been sedimentation changes through the 35 years. The questions are why and how this changes have affected the shore and the environment. Our job now will be to ask the students to come up with theories based of additional readings that can answer some of their questions. I have included some materials that will help students have a better understanding of sedimentation in the Long Island Sound.

Literature Reviews

Frank W. Bohlen. Phd. MIT Woods Hole
University of Connecticut, Avery Point Campus, Groton, CT.
From his website:
My research program is designed to increase our understanding of the dynamics governing the transport of fine-grained sediments in coastal and estuarine waters. In broad outline, this program consists of three principal components: field and laboratory experimental studies, instrument design and development, and numerical computer modeling. The field and laboratory investigations seek primarily to document the response of the sediment-water interface to both long-term persistent and short-term aperiodic, storm related factors. Many of the instrument systems required to obtain these observations have been designed and constructed at the University of Connecticut. Data provided by the deployment of these arrays in a variety of coastal environments has shown the interfacial response to be highly non-linear and significantly variable in both space and time. Such variability complicates specification of transport algorithms in numerical predictive models. Ongoing work seeks to extend and refine these observations to permit resolution of the specific factors governing transport non-linearities including consideration of biologically mediated variations in sediment fabric, particulate associated alterations in boundary shear stress, and advective effects associated with variations in the local flow field.
The experimental work will require continuing redesign and modification of the available instrument arrays. Existing optical systems, presently used to monitor suspended material concentrations, are to be improved and supplemented by a variety of acoustic systems in order to increase both spatial and temporal resolution. In addition, the field arrays are to be supplemented by a series of sensors intended to detail the fabric of the sediment column in the immediate vicinity of the sediment-water interface. A number of systems are to be tested including radioactive probes, acoustic and electromagnetic systems and simple mechanical probes with ultimate selection based on simplicity of operation and reliability and the potential to yield vertical resolution over scales of 1 mm or less.Patterns of recruitment, abundance and dominance within several subtidal communities in southern New England have been found to persist year after year over large areas of the bottom. This long-term persistence is not expected in such an open system with disturbances continually creating open patches for recruiting larvae whose identity and abundances change both temporally and spatially. Present research suggests that the persistence results from strong local control of recruitment that overrides any variability in larval production and dispersal of species from outside a site. We have been testing this hypothesis by conducting manipulative field experiments which delineate abiotic and biotic controls of local recruitment and how these affect community establishment and development.The variety of experimental work is being complemented by concurrent continuing development of a series of numerical models intended to incorporate the laboratory and field data for calibration purposes and to permit the extension of these data in space and time for predictive purposes.
Publications
Fredette, T.J., W.F. Bohlen and D.C. Rhoads. 1988. Erosion and resuspension effects of Hurricane Gloria at Long Island Sound dredged material disposal sites. Proc. Of Water Quality 1988. U.S. Army Corps of Engineers, Hydraulic Engineering Center, Davis, CA. Fenster, M.S., D.M. Fitzgerald, W.F. Bohlen, R.S. Lewis and C.T. Baldwin. 1990. Stability of giant sand waves in eastern Long Island Sound. U.S.A. Marine Geol. 91: 207-225.Bohlen, W.F. 1990. Ocean disposal of particulate wastes: practices, properties and processes. In: K.R. Demars and R.C. Cheney (eds.). Geotechnical Aspects Of Ocean Waste Disposal. Amer. Soc. for Testing and Materials, Spec. Pub.Bohlen, W.F., D.R. Cohen and M.M. Howard-Strobel. 1992. An Investigation of Sedimentation Induced by Gas Pipeline Laying Operations in the Vicinity of the Oyster Bed Lease Areas, Milford, CT. Prepared for Iroquois Gas Transmission System. Shelton, CT. 40 pp. & Figs.Bohlen, W.F., D.R. Cohen and M.M. Howard-Strobel. 1992. An Investigation of Water Column Currents and Suspended Sediment Dispersion Associated with Dredged Material Disposal Operations, Cornfield Shoals Disposal Site, Eastern Long Island Sound. Prepared for Science Applications international Corporation. Newport, RI. 49 pp. & Figs.Lissner, A., C. Phillips, E. Waddell, P. Hamilton, A. Barnett, D. Diener, P. Raimondi and W.F. Bohlen. 1995. Monitoring Assessment of Long-term Changes in Biological Communities in the Santa Maria Basin: Phase III. Report submitted to US Department of Interior Minerals Management Service/National Biological Service. Cont. No. 14-35-0001-30584.Bohlen, W.F., M.M. Howard-Strobel, D.R. Cohen and E.T. Morton. 1996. An Investigation of the Dispersion of the Sediments Resuspended by Dredging Operations in New Haven Harbor. Submitted to New England Division, US Army Corps of Engineers. Waltham, MA.


Charles W Ellis
Marine Sedimentary Environmnets in the Vicinity of the Norwalk Islands, CT. 1962
State Geological and Natural History Survey of Connecticut, 1962. Bulletin Number 94.

S. Jeffress Williams
Geological Framework Data from Long Island Sound, 1981-1990
USGS Digital Data Release, U.S Geological Suvey Open-File Report 02-002


Diatom Diversity

Diatom Analysis

I have compared the diatom composition of both sides of the core, the newest end probably no more than 5 years old and the bottom of the core which we presume to be 35 years old.
Small piece of sediment was taken using a spatula and dissolved in a small amount of water. This sediment can be clean using paleontology methods, but for the purpose of this exercise, I have just look at the sediment with a compound microscope at X400 magnification and sometimes at x1000.


Sample diatom

Diatoms are covered with silica and they are practically indestructible, so one can find diatoms on the sample. I have placed a small drop of sediment/water on a regular microscope slide and pan through the slide in search for diatoms. When I have found a diatom I have made a drawing of the specimen and take a picture with my microscope camera. Pictures are not necessary. My objective was to find as many different diatoms as possible. I am not looking at the abundance, just at the diversity. I also have compared the diatoms to pictures found in several diatom keys and identified the organisms as much as it was possible.

Results

I was able to identify a total of 9 different taxa from the bottom of the core, the old sediment, and 13 different taxa from the new sediment. There was higher diversity and much more abundance of organism in my new sediment.
Here are some of the picture I took.


Cyclotela

Closterium

Stauroneis

Correct identification of Diatoms is very difficult. But trying is a great exercise and will provide your students with a challenge.
Diatom diversity will be a direct outcome of a better and less polluted environment. Thirty five years ago would have been somwhere in 1975, the very beginning of the environmental movement and the establishment of the Clean Water Act. I can see that we may have had some improvement over this past 35 years that would be reflected on our samples.

Additional Reading from websites

http://www.epa.gov/regulations/laws/cwa.html
http://www.epa.gov/owow/watershed/wacademy/acad2000/cwa/
http://en.wikipedia.org/wiki/Diatom
http://www.globalissues.org/

The Diatoms: Biology and Morphology of the General F. E Round. Cambrige University Press.

Monitoring Coastal Environments Using Foraminifera and Thecamoebia Indicators. David B. Scott, Franco S. Medioli and Charles T. Schafer. Cambridge University Press.

The Ecology of Fresh Water Phytoplankton. C.S Reynolds. Cambridge University Press.


Saturday, November 27, 2010

Vernal Pool Project 2010

Introduction
Two vernal pools in Connecticut were study during the month of April for macroinvertebrate populations. The first pools was located at Flanders Nature Center in Woodbury and the second pool was located at Web Mountain in Monroe.
All the macroinveterbates were collected using a dip net, preserved in alcohol and identified later to the farther possible taxa. Both pools were populated by spring pipers and wood frogs.

Pool locations
Pool at Flanders is a latitude of 41.60010 decimal degrees and a longitude of - 73. 20289 decimal degrees. The pool at Web mountain is located at a latitude of 41.36488 decimal degrees and a longitude of - 73. 17296 decimal degrees. This pool was 3 times larger that the pool at Flanders.

Results

Flanders

Number Group Taxa
39 Crustacea Caedidotea Communis
17 Gastropoda Physa heterostropha
2 Insecta Chaulionidae spp. (Megaloptera)
2 Insecta Leptophobia spp. (Ephemeroptera)
6 Insecta Cromagrion spp. (Odonata)
1 Insecta Limnephilidae (Platycentropus ?) (Tricoptera)
4 Gastropoda Veneroida spp.
1 Insecta Pyralidae (Lepidoptera)

Web Mountain

31 Crustacea Caecidotea Communis (Isopods)
1 Gastropoda Fingernail Clam (sphaerium spp.)
1 Insecta Megaloptera (Corydalus spp.)
21 Insect Beetles (Coleoptera) Prionocyphon spp.
8 Insecta Midges (Chironomidae)
2 Insecta Phanton midges (Chaoboridae)
1 Insecta Adult Cadisfly (Trichoptera)
7 Insecta Primitive minnow mayflies (siphlonuridae)
1 Arachnida Spider
1 Insecta Dult beetle (Coleoptera)
1 Insecta Damselfly (Coenagrionidae)
1 Insecta Coleoptera (Elmidae)


Conclusions
In both pools the community was composed mainly of crustaceans, gastropods and insects. Isopod crustaceans were intensely abundant, Fingernail Clams appeared in both pools. There was a broader variety of insect orders between both pools. The size of the pool may have been the limiting factor for the insect population at Flanders. Diptera was much more abundant in the larger pool.

Saturday, July 24, 2010

Bog at its best


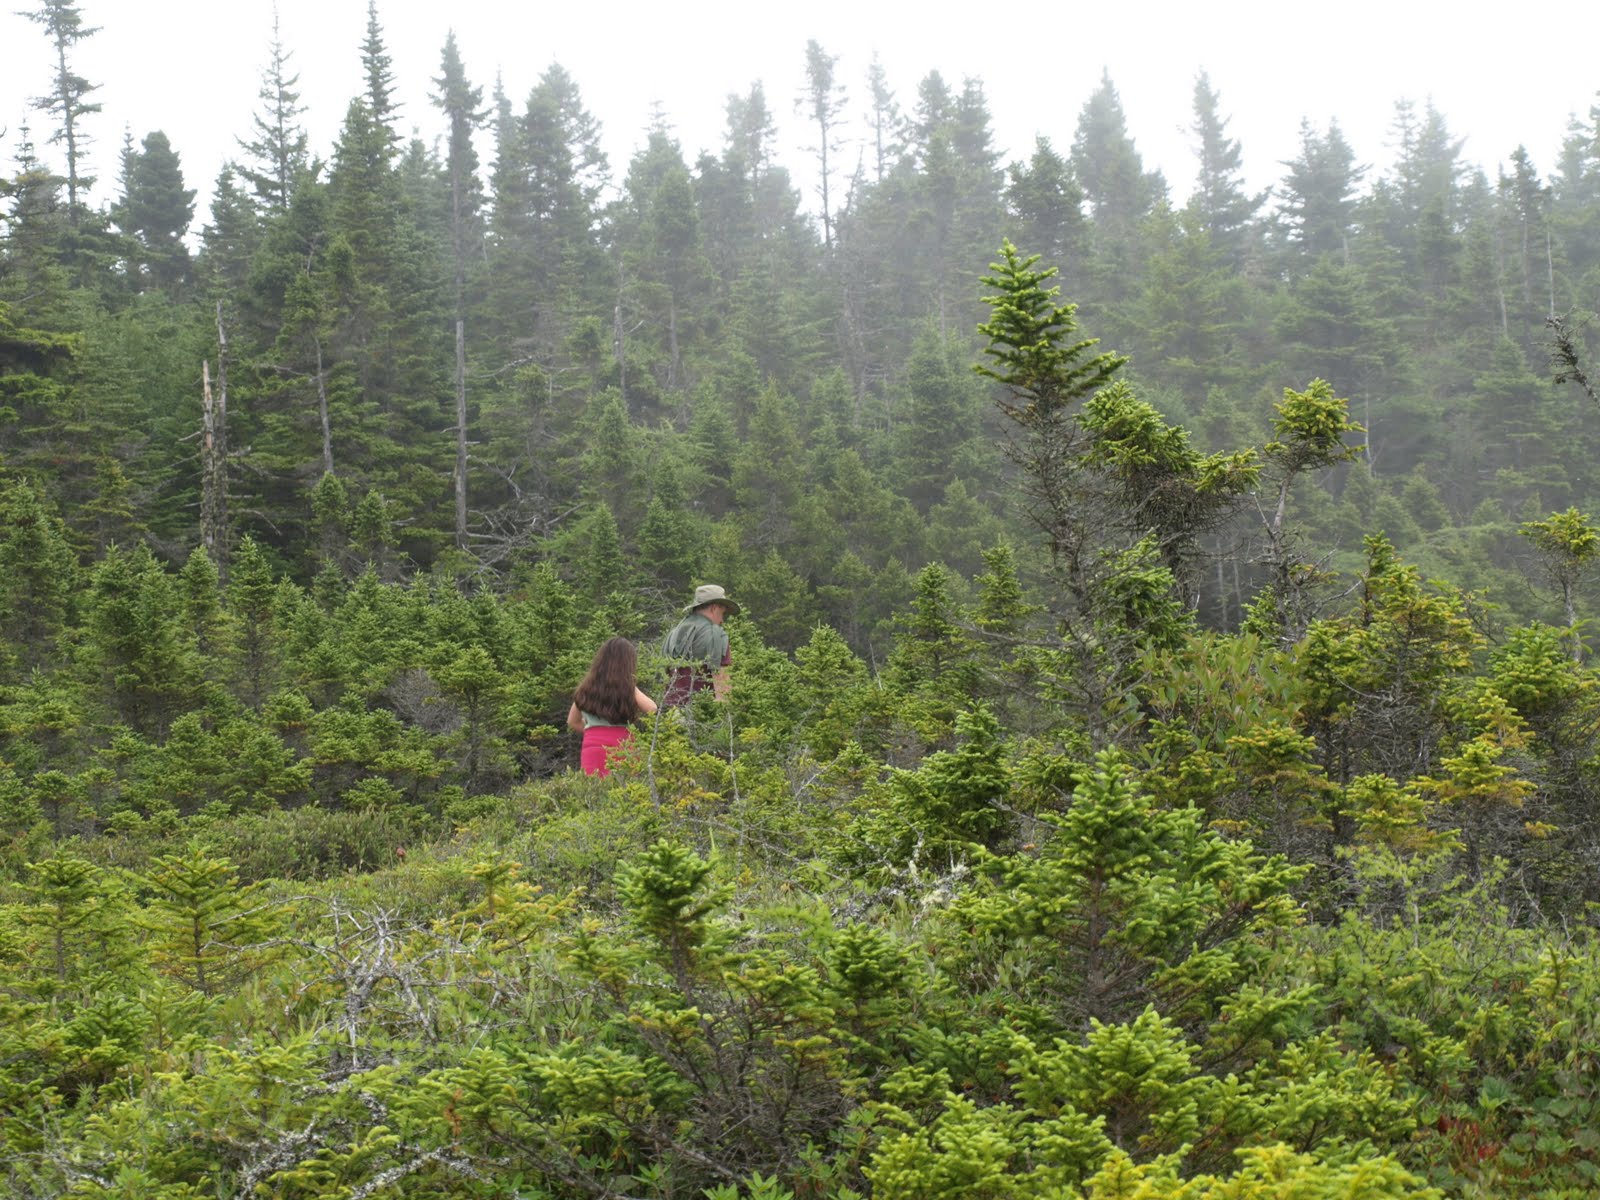
In one of my recent vacations I traveled to West Quoddy Head State Park in Lubec, Maine. This beautiful seashore park is the eastern most point in the Continental United States. A wonderful shore location along steep hills and cliffs that grab the attention of most travelers.
Inside the park and along the mayor trail is a black spruce bog where I took some of these pictures. Here anyone can find unbelievable pitchers plants, sundew, Labrador tea, and many more typical artic or tundra plants. These 10 acre bog is a classroom at its best. Lovely to see when the fog comes in from the shore and lightens its mystic character for everyone there to see. Enjoy the pictures and if you need information on how to get there write me a note!


Wednesday, April 28, 2010


Web Mountain Park is a small preserved located in Monroe. Last week some of my high School kids spotted this female Mallard (Anas platyrhynchos) seating on its eggs.
It was amazing to me the ability of this bird to hide in the woods next to a large tree and close to a small stream. Go out there! Open your eyes! And you will discover the wonders of nature.

Thursday, April 22, 2010


A word on Invasive Japanese Knotweed

Invasive plants are an alarming problem, and especially when a patch of these plants are found on a central area within a nature sanctuary. Two days ago as I was hiking inside the white trail in the Whittemore Sanctuary in Middlebury, CT. I found an impressive Japanese Knotweed patch within a forested clearing. This growth will expand to new areas if not carefully eradicated.
Japanese Knotweed or Polygonum cuspidatum also known with the names of Mexican bamboo, Japanese’s fleece flower or crimson beauty is a persistent plant that is very difficult to eradicate. It requires annual and consistent cut or pull sometimes 2 or 3 times during the growing season. Some herbicides will also help.
This plant can change the ecosystem by quickly spreading to form dense patches that will exclude native plant populations. It can survive floods, high salinities, and can cause structural damage to foundations.Walk you favorite nature area and look for invasive plants that if eradicated soon will keep the nature area pristine. Alberto F. Mimo

Wednesday, August 26, 2009

The art of the Naturalist

By Alberto F. Mimo

Jimsonweed at a Rhode Island Beach

Datura stramonium is a rather large annual herb that was flowering at Roger Wheeler State Beach. This beautiful and toxic plant contains Totropane Alkaloids that can cause hallucinations and death. I took these pictures for your enjoyment.


Some important points to remember


  • You do not have to walk around the world and know what everything is!


  • Walk with a sense of discover!


  • Feel just like if you were Humboldt or maybe Darwin!


  • Choose one plant


  • Is a tree, or maybe a shrub, or forbs?


  • f it is forbs, is it a flowering plant, a grass or maybe a fern, or one of the non- vascular plants like a moss?


  • Work your way with the right ID book and find what it is?


  • Start to fill in your data sheet and ask all the questions. Spend time with each question! This is not a race to see who can ID the most plants. This is an experience, the experience of the scientist, the naturalist!


  • Is your plant found only here? Do I find it everywhere?


  • Is your plant rare?


  • To what family does it belongs?


  • Draw a sketch, Take a picture, and Test the pH of the soils!


  • Oh soils! How much is there to learn about them and how little attention we pay to them! Using the web you can learn lots about the particular soils where you found your plant. Use the tools you have around you, we are not anymore in the Stone Age! Tools are the web, microscopes, GPS units, Maps of all kinds, Books and more books


  • Can you write something about this plant? If you can’t use books and the web to get information


  • A plant is not just a plant, it lives with a community, is found within a particular season, it inhabits a special place! Take a look at the whole subject, not just the plant! Habitat, habitat, habitat! Nitch, nitch, nitch!


  • Take measurements, calculate percent cover, dominance. Use plant-measuring techniques!


  • Spend time with your plant; take a good look at it. Look at its leaves, the flowers, the fruit, and the roots! Every one of these parts evolved with a particular idea in mind. Why is your plant the way it is? How does it relates to its nitch?


  • Are there any friends with your plant? It is being eaten by some insect. Interspecific relationships between different organisms are some of the important things to note, don’t miss the opportunity!


  • Take a sample, press it carefully, once it’s dry, mount it with care, make a label. Go back to your notes and sketches and work with them to fine tune your work!


  • Add your collection to you database; have you have collected it before? If so, where? Compare the two collections.


  • Each plant belongs to a family; each family has its own story. Learn about all that!


  • Take your time and learn the ways of a good naturalist!

    Notes from RI